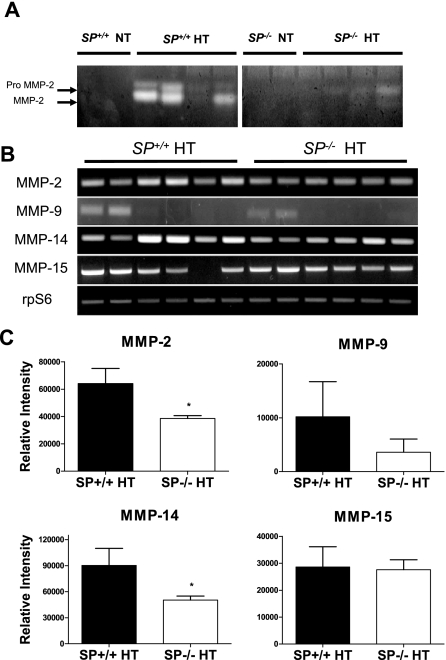
Figure 2.
SP−/− mice show an amelioration of urinary MMP-2 activity after ANG II infusion. A: Gelatin zymography revealed that SP+/+ mice exhibited a greater increase in urinary MMP-2 activity after ANG II infusion, compared with SP−/− mice. Figure is representative of three independent experiments. B: mRNA expression levels of renal MMPs in hypertensive SP+/+ and SP−/− mice (n = 6 each) as determined by RT-PCR; results shown are representative of three independent experiments. C: Quantification of the relative band intensities of MMPs after normalization to corresponding rpS6 internal controls. *P < 0.05 versus SP+/+ HT.

