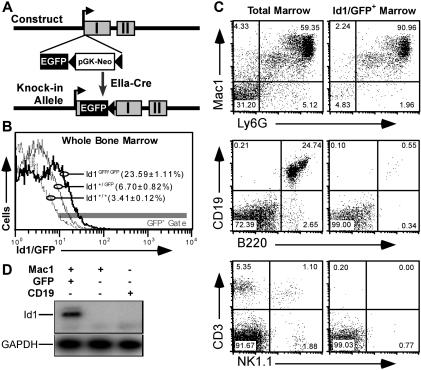
Figure 1.
GFP knock-in as a model for tracking Id1 expression. (A) Schematic diagrams showing the knock-in construct and knock-in allele. EGFP and pGK-Neo were inserted in the 5′ untranslated region in exon I (▩) of the Id1 gene. (B) Relative GFP fluorescence in WBM from Id1+/+ (- - -), Id1+/GFP (–), and Id1GFP/GFP (–) mice. Parentheses indicate the average fraction of marrow ± SEM from 9 samples from each genotype falling within the indicated fluorescence gate (▩). (C) Immunofluorescence showing Id1/GFP expression in specific bone marrow lineages. Left panels give total marrow profiles for the indicated markers. Right panels show those cells falling within the GFP+ gate indicated in panel B. Numbers are percentages of events in each quadrant. (D) Correlation between Id1 and GFP expression. Id1+/GFP marrow was labeled with antibodies against Mac1 (PE) and CD19 (APC), and sorted for the indicated subsets. RNA was extracted from the sorted samples and probed by RT-PCR for Id1 and GAPDH transcripts.

