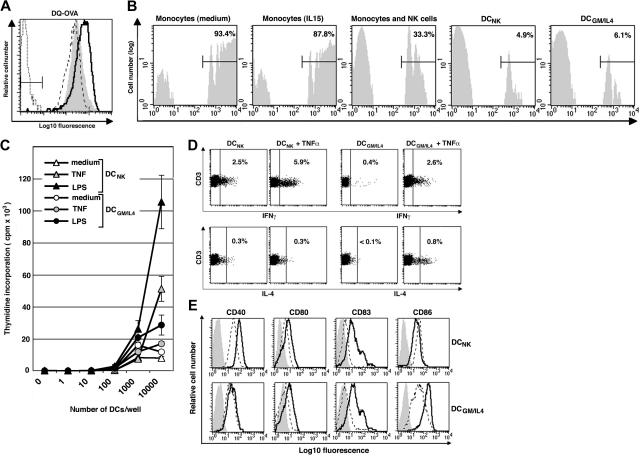
Figure 3.
DCNK take up antigen by endocytosis, lose phagocytic capacity, and exhibit potent T-cell stimulatory ability. (A) Antigen uptake by endocytosis as assessed by adding DQ-OVA to monocytes cultured in medium alone (filled gray histogram) or in the presence of GM-CSF and IL-4 (- - -), or monocytes cocultured with an NK-cell clone (–). Cells were incubated with DQ-OVA overnight and subsequently analyzed by flow cytometry. A combined gate was set on monocytes/DCs based on their CD56− and FSC:SSC profiles. The histogram of NK cells alone (using a combined gate of CD56+ and FSC:SSC) is shown to indicate the fluorescence intensity of nonendocytic NK cells (· · ·). (B) Phagocytic activity, as measured by uptake of FITC-conjugated latex beads of monocytes cultured in medium alone, with IL-15, with NK cells in medium alone (monocytes NKs cells), NK cells and IL-15 (DCNK), or GM-CSF and IL-4 (DCGM/IL4). A combined gate was set on monocytes/DCs based on their CD56− and FSC:SSC profiles. Percentages indicate phagocyte activity. Results are representative of 2 separate experiments. (C) DCNK induce potent proliferation of naive allogeneic CD4+ T cells. DCGM/IL4 (circles) and DCNK (triangles) were isolated on day 6 and stimulated with TNFα (gray, 10 ng/mL), LPS (black, 1 μg/mL), or left in medium alone overnight (white). The DC were thereafter irradiated (3000 rad) and incubated at graded doses with naive CD4+ T cells as indicated. After 7 days, the cells were pulsed with [3H]thymidine and proliferation is expressed in counts per minute (cpm) × 103 (mean ± SD of triplicate cultures). (D) DCNK or DCGM/IL4 were stimulated overnight with either 10 ng/mL TNFα or medium alone before coculture with T cells (1:1 ratio) as indicated. Assessment of intracellular IFNγ (top) and IL-4 (bottom) was done using PE-conjugated anti-IFNγ and anti–IL-4 mAbs after a 72-hour culture, and the percentages of cytokine positive cells are indicated in each dot plot. IFNγ or IL-4 produced by T cells without DC stimulation, or by monocyte stimulation, was less than 0.1%. The vertical line is set to indicate the background of the isotype control staining. Results are representative of 3 separate experiments. (E) Phenotypic maturation of DCNK (top panels) and DCGM/IL4 (bottom panels). Parallel cultures of DCNK and DCGM/IL4 were harvested on day 6 and stimulated with 10 ng/mL TNFα, or kept in medium alone, for an additional 48 hours. Cell surface expression of CD40, CD80, CD83, and CD86 on TNFα-matured DC (–) is compared with immature DC (- - -). Gray histograms show staining with isotype control antibody.

