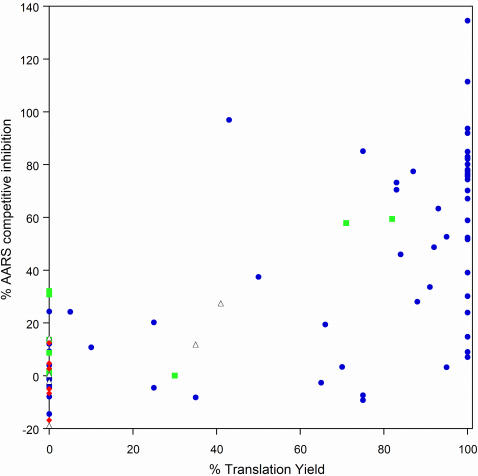
Figure 10. Comparison of % AARS competition and % translation yield for all of the analogs shown in Table 1.
The symbols are as follows: blue circles—side chain analogs, green squares—α,α disubstituted amino acids, black open triangles—N-methyl amino acids, red diamonds–β-amino acids. Translation yields for analogs that gave multiple peaks in the translation experiment were set to zero for this graph.

