
Figure 3. Input CD8 T cell precursor frequency dictates the kinetics and efficiency of the CD8 T cell response.
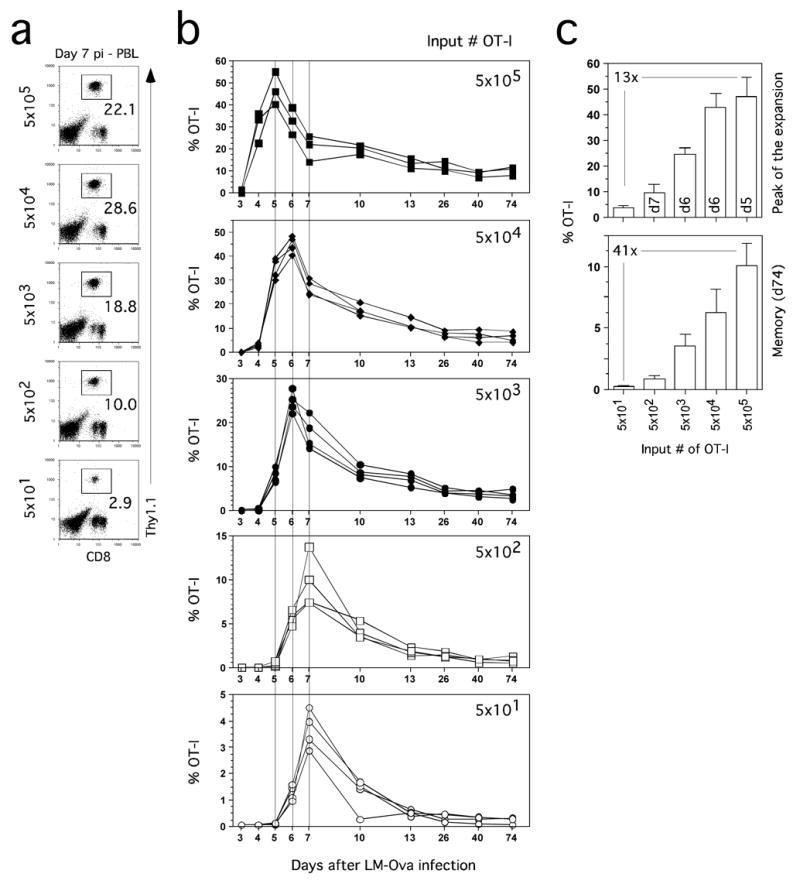
Purified naïve OT-1 Thy1.1 cells at the indicated numbers were transferred into B6 Thy1.2 mice and one day later mice were immunized with Att LM-Ova. Expansion of OT-1 Thy1.1 cells was followed in the blood at indicated days p.i.. (A) Detection of OT-1 cells in the blood of representative mice on day 7 p.i. Numbers represent the frequency of OT-1 cells among PBL. (B) Kinetic analysis of OT-1 response in the blood. Responses of individual mice in each group are shown. (C) Frequency of OT-1 cells detected at the peak (top, day indicated inside bars) of expansion or at a memory (bottom, day 74 p.i.) time point. Numbers inside panels indicate the fold-difference in frequency of OT-1 cells between the highest and lowest input groups.