
Figure 6. Initial precursor frequency alters the kinetics and phenotype of P14 TCR-tg T cells responding to LCMV.
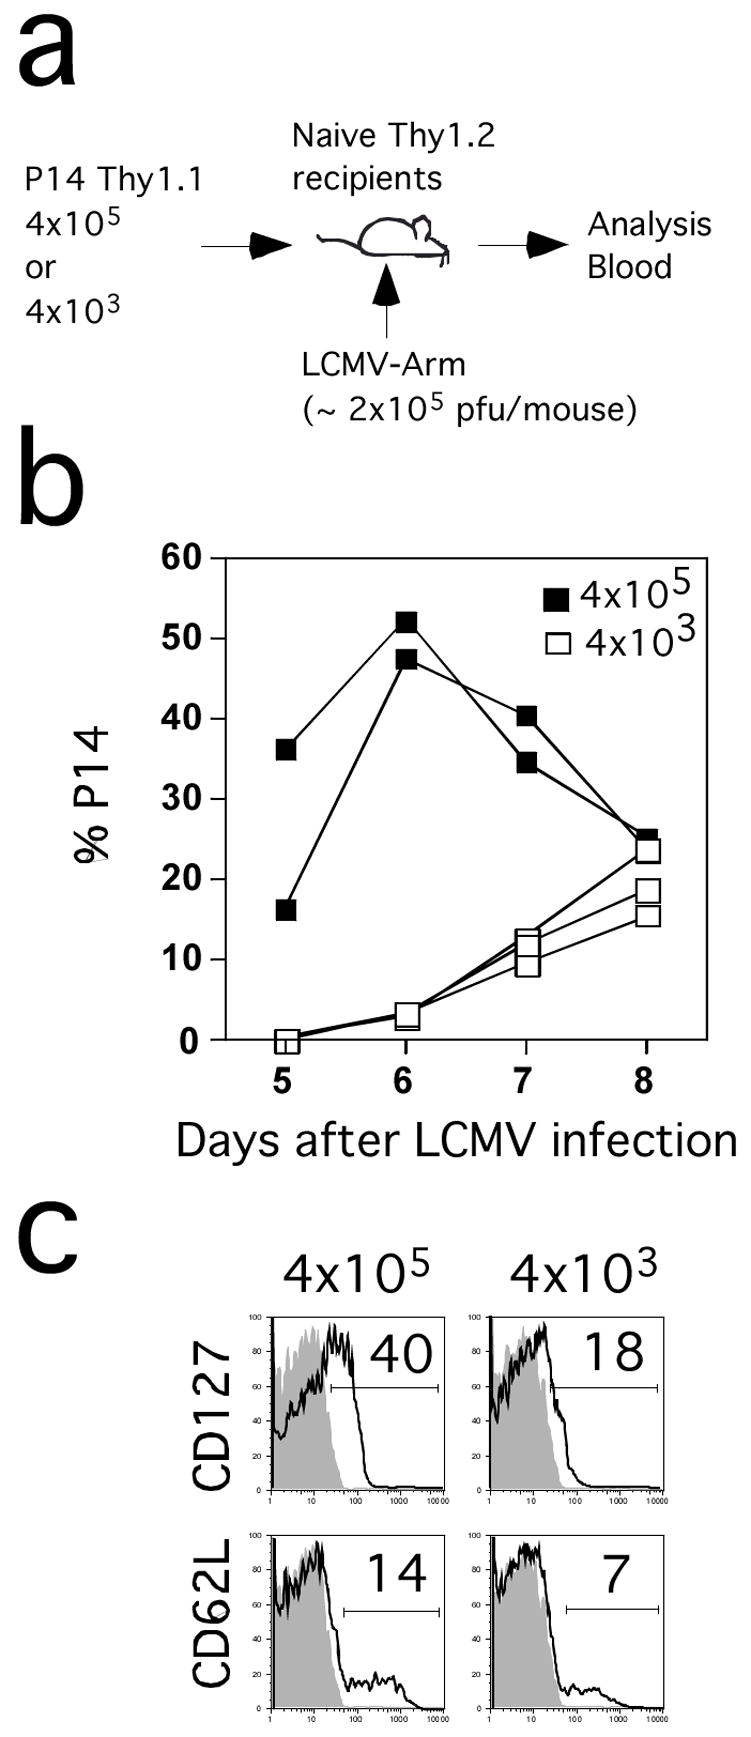
(A) Purified naïve P14 Thy1.1 cells at the indicated numbers were transferred into B6 Thy1.2 mice and one day later the recipient mice were infected with LCMV. Expansion of P14 Thy1.1+ cells was followed in the blood at indicated days p.i.. (B) Kinetic analysis of P14 responses in the blood. Responses of individual mice from each group are shown. (C) CD127 and CD62L expression on gated P14 cells from pooled blood samples from each group at day 8 p.i. Shaded histograms represent isotype control staining. Numbers represent the frequency of P14 cells that are positive for CD127 or CD62L.