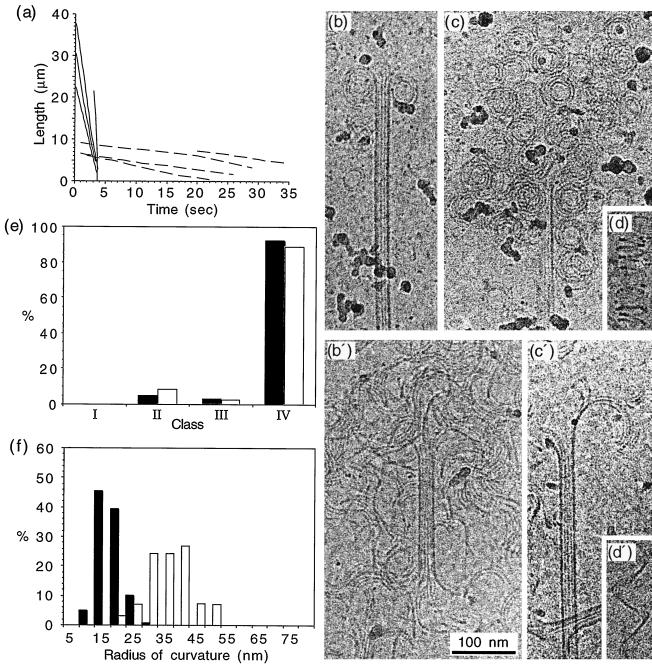
Figure 3.
Depolymerization of GDP and GMPCPP microtubules in the presence of 4 mM calcium. (a) Length versus time plots of GDP (plain lines) and GMPCPP microtubules (dotted lines). Depolymerization rates of −611 ± 125 μm/min and −13.0 ± 3.2 μm/min were measured for GDP and GMPCPP microtubules, respectively. (b–d) Depolymerization products of GDP microtubules. (b′–d′) Depolymerization products of GMPCPP microtubules. Curved oligomeric structures (b, b′, c, c′) and spirals of protofilaments (d, d′) were observed in both cases. (e) Percentage of end types observed after calcium depolymerization of GDP (black bars) and GMPCPP microtubules (open bars). About 90% of both GDP and GMPCPP microtubule ends displayed curved oligomers. (f) Curvature of the oligomers observed during calcium depolymerization of the GDP (black bars) and GMPCPP microtubules (open bars). The average radius of curvature was 20 ± 4.1 nm and 38.6 ± 7.1 nm for GDP and GMPCPP oligomers, respectively.

