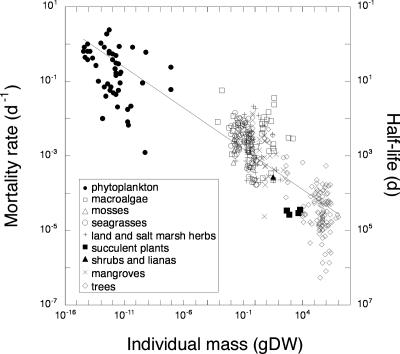
Fig. 1.
The relationship between plant mortality rate (D) and the individual mass (M) of plants ranging across phytoplankton, macroalgae, mosses, seagrasses, land and salt marsh herbs, succulent plants, shrubs, lianas, mangroves, and trees. The line shows the fitted regression equation D = 0.0009 M−0.22 (slope, 95% c.l. −0.23 to −0.21, r2 = 0.77, n = 396). The corresponding half-life is also indicated in the plot. gDW, grams dry weight.

