
Figure 2. Behavioral categorization data.
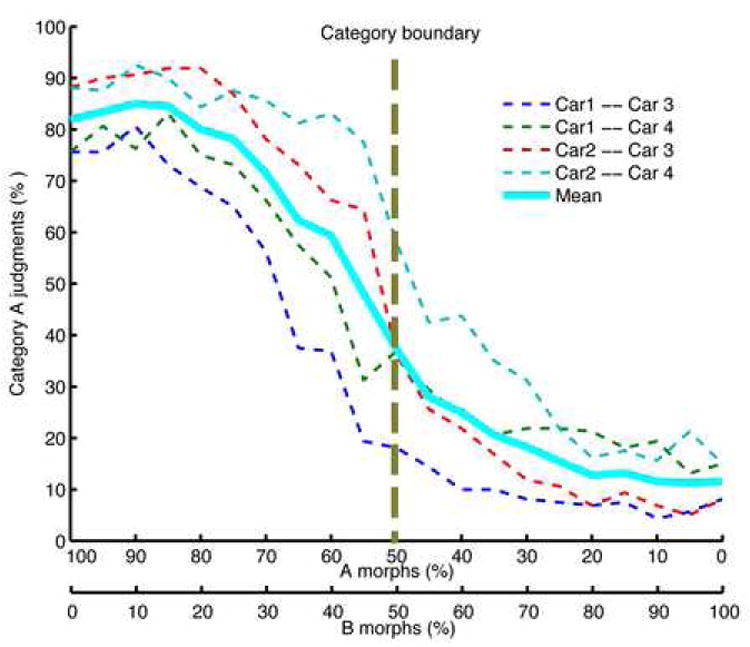
The average performance (in percent correct on the 2AFC categorization task) along the four cross-category morph lines (dashed), along with the grand average over all morph lines (solid line). The X-axis shows percent morph. To better capture the steep transition around the category boundary that was blurred by averaging across participants and morph lines, we also fitted sigmoid functions to individual subject performances and then averaged across the fitted sigmoid parameters, see Figure S2.