
Figure 10.
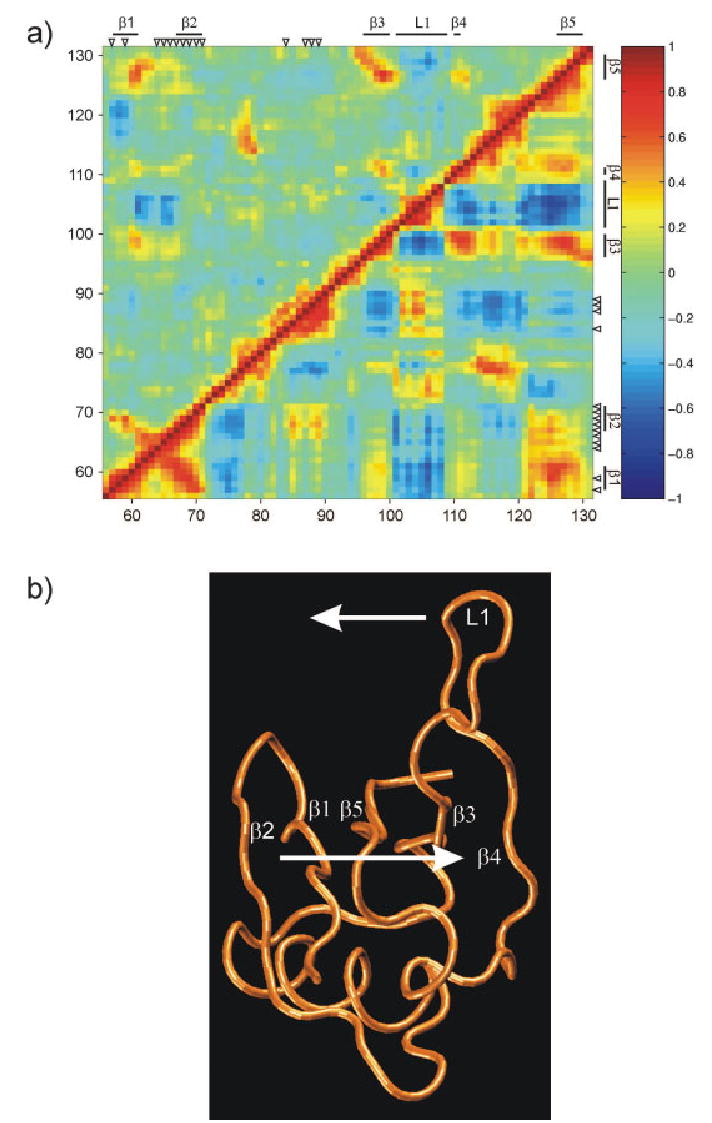
Crosscorrelation map [Eq. (9)] of Cα atomic fluctuations of Raf. (a) The two axes refer to residue indices. Positive correlations are indicated in red, negative in blue. The correlations for the unbound protein are shown in the upper left triangle, the ones for the bound protein in the lower right triangle. Residues in the interface region are marked with ▽, secondary structure elements are indicated by bold lines. Part (b) schematically shows the anticorrelated motion between the β-sheet consisting of β1–β5 and the loop L1 region that occurs in the bound state of Raf.