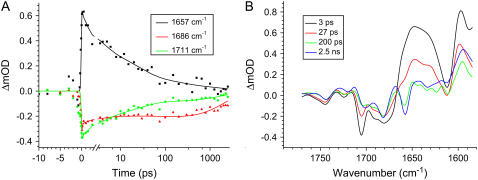
FIGURE 1.
Pump-probe measurements in the mid-IR on excitation at 681 nm, Pexc = 250 nJ. (A) Time traces detected at 1657, 1686, and 1711 cm−1. The scale is linear up to 3 ps and logarithmic thereafter. The solid line through the data points is a fit with time constants of 3 ps, 27 ps, 200 ps, and 2.5 ns; the very fast component that follows the IRF is also included. (B) EADS resulting from sequential analysis of the data using a model with increasing lifetimes.

