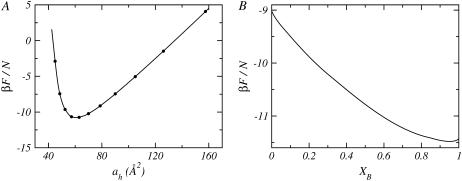
FIGURE 2.
(A) Free energy per molecule as a function of the area per lipid headgroup, ah, for a mixed lipid layer with nL = 14 and XB = 0.50. (B) The optimal free energy per molecule as a function of the layer bolalipid concentration, XB, for a mixed lipid layer with nL = 14. The optimal free energy is obtained from the minimum of a curve (as shown in A) for each composition.

