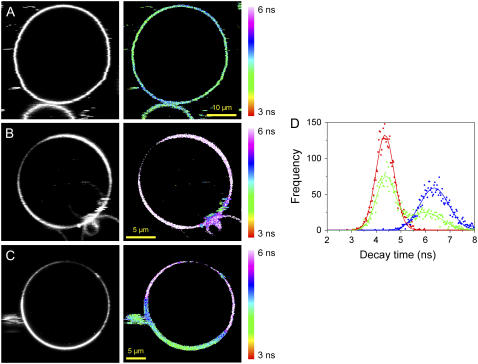
FIGURE 7.
Fluorescence intensity (gray) and fluorescence lifetime images (color) obtained for PMI-COOH in GUVs composed of different lipid phases: (A) Ld phase (DOPC); (B) Lo phase (DPPC plus 30 mol % cholesterol); (C) Lo/Ld phase separation (DPPC/DOPC/Cholesterol 0.56:0.24:0.20 molar ratio). The images were recorded using 488-nm excitation and the emission was collected with a 525-nm longpass filter. All FLIM images are represented using the same scale bar, from 3 to 6 ns. (D) Distribution of the decay times determined for each phase: Ld phase, red; Lo phase, blue; Lo/Ld mixture, green.

