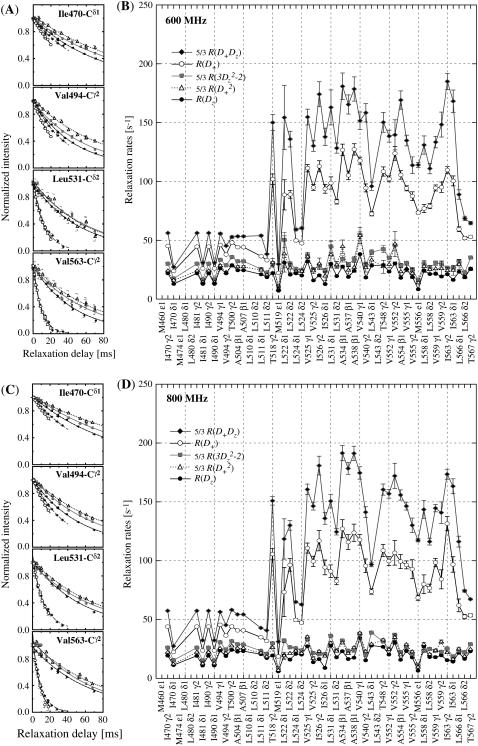
FIGURE 7.
2H relaxation decay curves and relaxation rates of PX. The relaxation curves at both 600 (A) and 800 (C) MHz are from two residues in the unstructured N-terminal subdomain (I-470 and V-494) and two in the structured C-terminal subdomain. The fitted relaxation rates are shown at 600 (B) and 800 (D) MHz are scaled for comparison as indicated on the graph.

