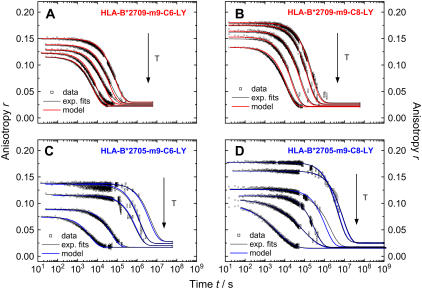
FIGURE 5.
Time-dependent change in anisotropy of LY-labeled HLA-B27-complexes at different temperatures. (Top) Subtype HLA-B*2709 complexed with m9-C6-LY (A) and m9-C8-LY (B) at 22, 26, 30, 34, and 37°C. (Bottom) Subtype HLA-B*2705 complexed with m9-C6-LY (C, at 26, 30, 37, 50, and 60°C) and m9-C8-LY (D, at 26, 30, 37, 50, 55, and 61°C). Black lines represent mono- or biexponential fits (dependent on temperature, a stretched exponential had to be applied in HLA-B*2705, panel D). Colored lines represent the model fits according to Eq.12 and 17 to the respective data set. (A stretching factor 1/h was considered in Eq. 17 for data at 55 and 61°C, displayed in D.)

