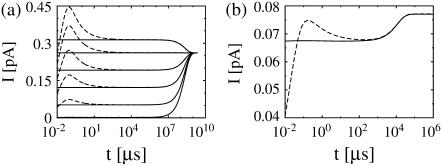
FIGURE 4.
Approximation of the single channel current: dashed lines show the exact solution of the expressions in Eq. 8, solid lines the approximation (Eq. 1) with  and
and  from the solution of the expressions in Eq. 22. The approximation is excellent for t > 102 μs. Beside initial concentrations, all other parameter values are from Table 1. (a) The case with Dirichlet boundary conditions in the cytosol. The initial concentration within the ER varies from 5 μM to 900 μM from bottom to top as in Fig. 2 a, and we used always the same initial cytosolic concentration of 0.1 μM. (b) The approximation with no-flux boundary conditions can be calculated analytically (expressions in Eq. 25). The initial cytosolic concentration is 10 μM, the initial concentration in the ER is 150 μM, and identical diffusion coefficients as in Fig. 2 b were used. The approximation captures the slow dynamics due to varying average concentrations.

