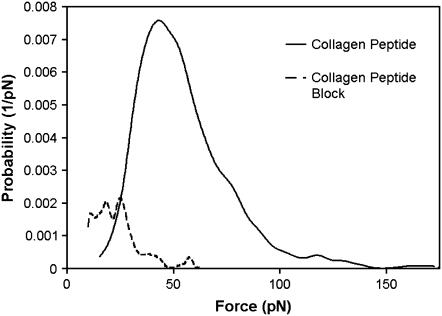
FIGURE 8.
Empirical probability density function for collagen peptide force experiments. The solid line represents force spectroscopy experiments with q2.0% and a collagen-related-peptide-functionalized tip. The dashed line represents the same experiment, but the system is flooded with excess peptide. Specificity of the peptide for Fn is shown by the decrease in probability and force when excess peptide is present.

