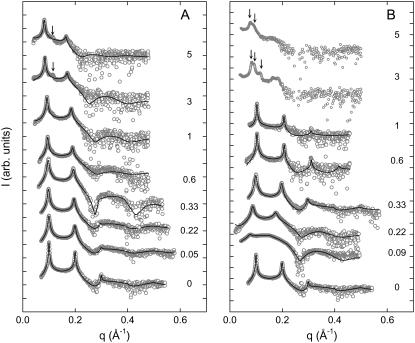
FIGURE 1.
Diffraction patterns of POPC at 300 K in the presence of NaCl (A) and CaCl2 (B). Numbers adjacent to the data denote the respective salt concentrations in M. Solid lines give the best fits obtained using the global analysis technique. Arrows indicate the position of additional first-order Bragg peaks due to phase separation.

