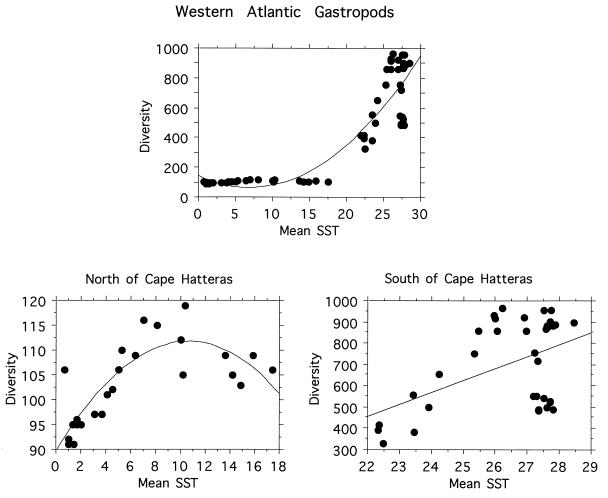
Figure 5.
Relationships between mean annual SST and diversity for western Atlantic marine gastropods. (Upper) All data points combined. The second order polynomial regression gives a significant relationship, R2 = 0.82, P < 0.0001. (Lower, Right) The relationship south of Cape Hatteras (i.e., tropical and subtropical species). R2 = 0.24, P = 0.007. (Lower, Left) The relationship north of Cape Hatteras, R2 = 0.668, P = 0.0002. Data are spatially autocorrelated so the regression statistics should be used only for comparative purposes.

