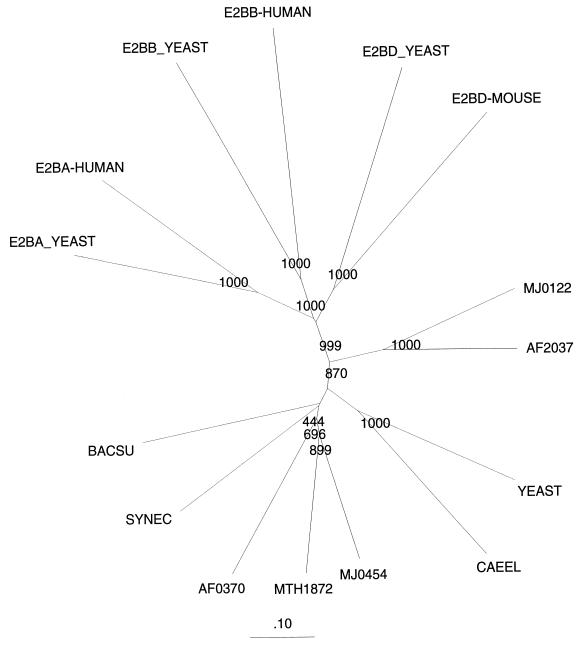
Figure 2.
A neighbor-joining (NJ) tree (41) showing distance relationships as derived from the multiple alignment presented in Fig. 1. The tree was calculated by using clustalw and visualized by treetool. Bootstrap (12) out of 1,000 tests for some important branching patterns is shown. Protein parsimony analysis (protpars) from the phylip package (Ver. 3.55c) (30) gave the same results with the NJ tree. Names and their references are as in Fig. 1.

