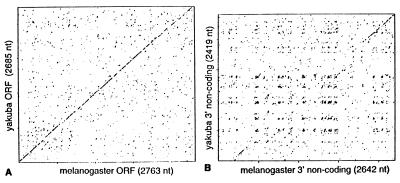
Figure 7.
Dot matrix comparisons of HeT-Ayak with HeT-Amel nucleotide sequences. (A) The coding regions have 64% identity. Identical nucleotides are spread relatively evenly and thus give a nearly continuous diagonal line over the entire region. (B) The 3′ noncoding regions have only 48% identity. This identity is most pronounced in the most 3′ sequences (upper right) and a diagonal line is detected at this location. In most of the comparison, there is not enough sequence identity to yield a diagonal line; however, off-diagonal clusters indicate a pattern of sequence repeats that is conserved.

