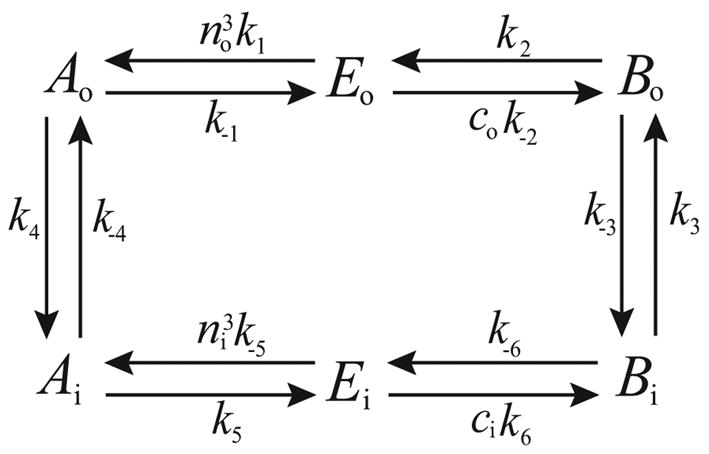
Figure 16.

State diagram of the NCX model: E denotes the carrier protein, A denotes the carrier protein with 3 bound sodium ions and B denotes the carrier with 1 bound calcium ion. The subscript o refers to the outside of the cell, and i to the inside.
