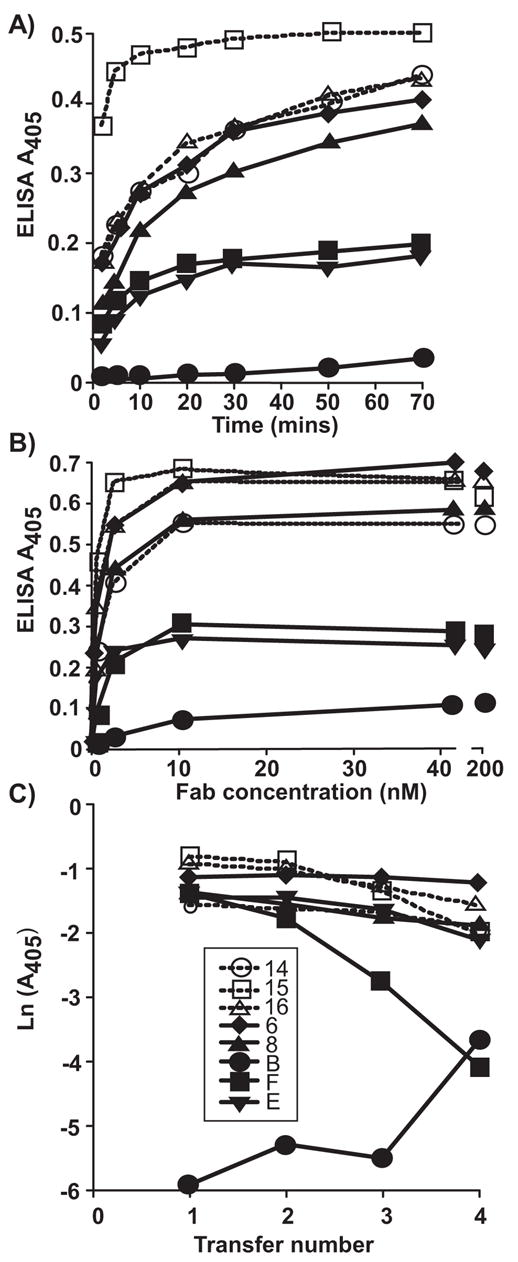
Figure 2.

Determining the binding affinities of the 8 Fabs to the CPV capsids by measuring the kinetics of binding, the saturated binding level, and the degree of binding when the Fabs were incubated with the viral antigen and then transferred to a new well after various times; the 30 min transfer data is shown as an example. (A) The rate of Fab binding to the antigen, tested by allowing the Fabs to incubate for various times with the capsids before washing, then detecting with anti-mouse or anti-rat IgG HRPO conjugates. (B) The saturation of binding for the 8 different Fabs, showing the binding when the antigen was incubated with increasing amounts of the Fabs, allowing the saturated binding to be estimated. (C) The binding of each Fab in a transfer assay where the Fabs were incubated with the antigen for 30 min before transferring to a new well. This was repeated 4 times for various lengths of time; the 30 min data is shown here.
