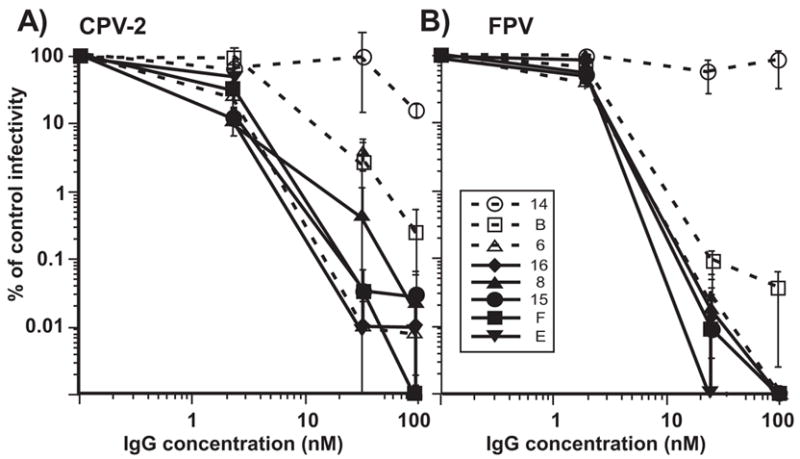
Figure 3.

The neutralization of (A) CPV-2 and (B) FPV infectivity by various amounts of the IgGs of the 8 different MAb tested here. The IgGs were added to 10,000 TCID50 of each virus at concentrations between 0 and 100 nM, incubated for 1 h at 37°C, then the surviving virus was diluted and tested for surviving TCID50 in CRFK cells. The results are shown as the surviving infectivity in each culture compared to the titer of the control virus. Bars show the standard error of the mean, comparing the results of 3 separate experiments done on separate days.
