
Figure 6.
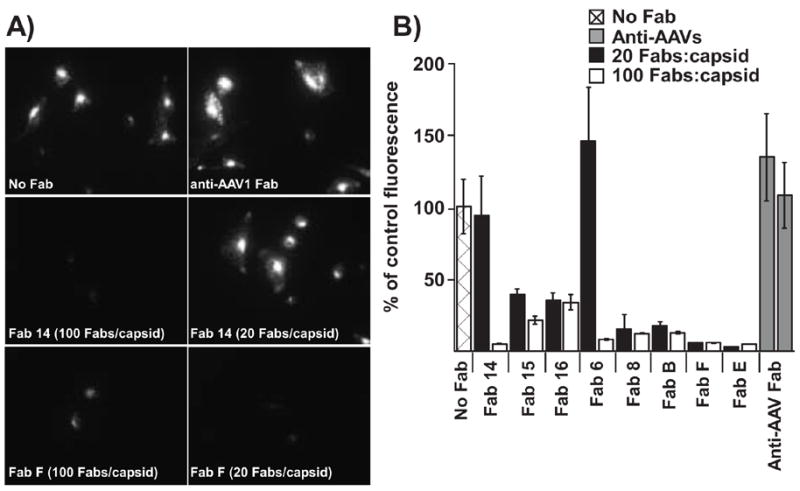
Competition by Fabs for cell binding and uptake. CPV-2 capsids were incubated with varying amounts of the Fabs for 1 h at 37°C, then bound to TRVb cells expressing the feline TfR. (A) Representative micrographs are shown for the no Fab control, and the Fabs against the A site (Fab 14) or the B site (Fab F). (B) Total average cell-associated fluorescence (per cell) was determined for at least 20 cells at each concentration. Results are plotted as a percentage of the CPV bound to cells in the absence of any added Fabs. The control anti-AAV Fabs were tested at 100 Fabs/capsid.