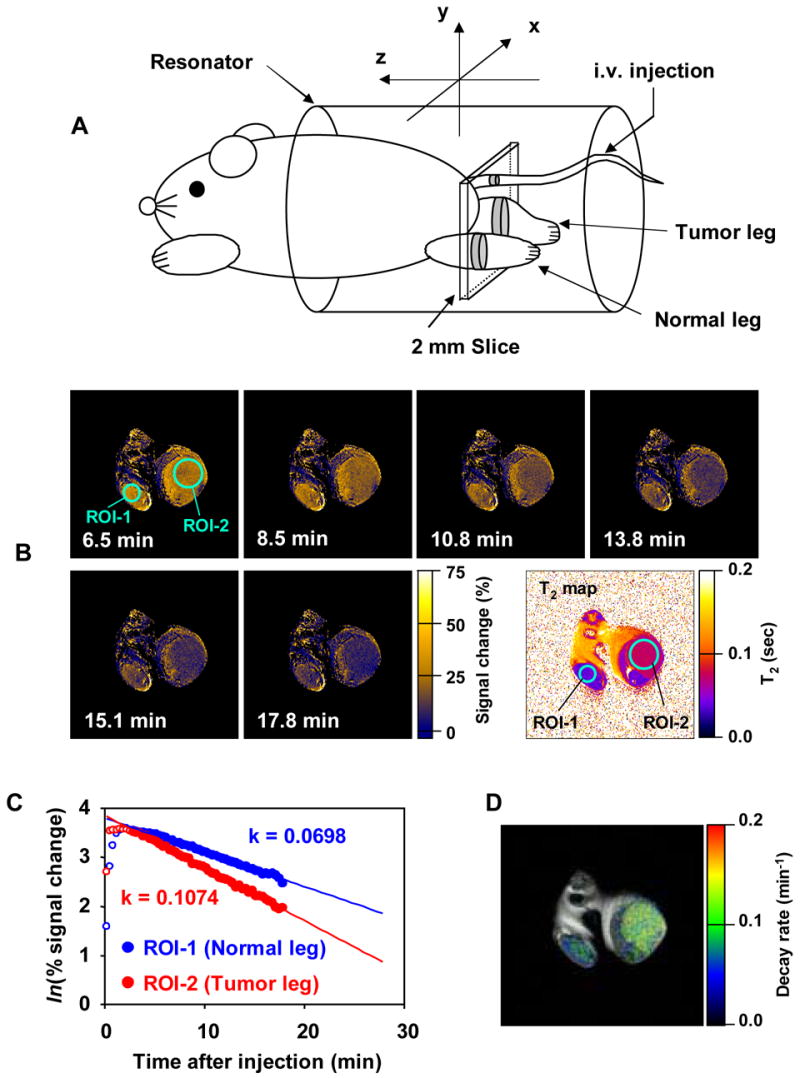
Figure 9. Nitroxide Imaging Studies.

A) Experimental arrangement of the mouse in the MRI resonator and the slice selected to monitor the nitroxide levels used to examine the differences in nitroxide metabolism in tumor and normal tissue. (B) Sequence of T1-weighted MR images as a function of time after intravenous administration of 3CP. Signal intensity in normal (ROI-1) and tumor leg (ROI-2) increase after administration and reach a maximum at 8.5 min. Signal decreases faster in tumor region than in normal tissue. Intensity change plotted as a function of time in the normal leg was observed to be ~60% compared to that in tumor. (C) The rate of intensity change in each pixel was computed and (D) a parametric image redisplayed shows that tumor reduction globally is elevated compared to the normal tissue. (Adapted with permission from reference # 5)
