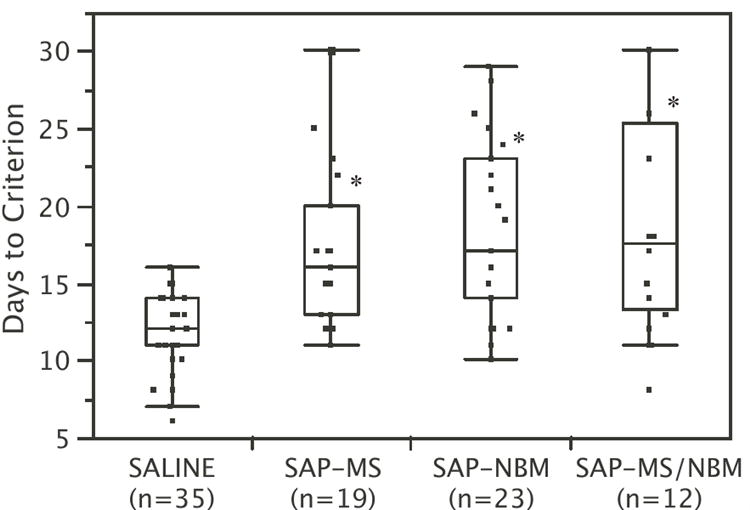
Figure 2.

Box and Whisker plots summarizing the effects of SAP lesions on Days to Criterion (DTC) on the DMP task. Each box surrounds the upper and lower quartiles (i.e., middle 50% of the data). The line in the middle of the box shows the median. The lines extending from the box extend to the upper and lower adjacent values (within 1.5 times the interquartile range). *p<0.05 relative to saline-treated controls.
