Figure 3.

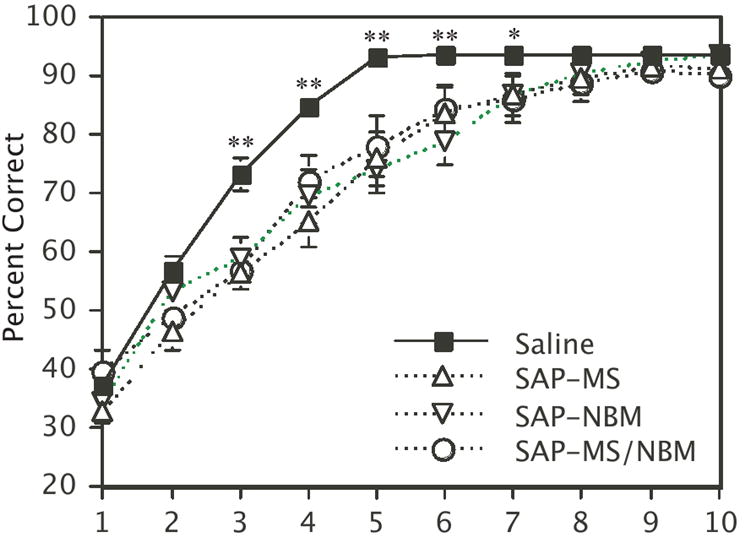
Plot showing the effects of the SAP lesions on the DMP learning curves Points represent the mean percent correct for each group ± s.e.m. **p<0.01, *p<0.05 for saline-treated animals relative to each of the SAP-treated groups.

Plot showing the effects of the SAP lesions on the DMP learning curves Points represent the mean percent correct for each group ± s.e.m. **p<0.01, *p<0.05 for saline-treated animals relative to each of the SAP-treated groups.