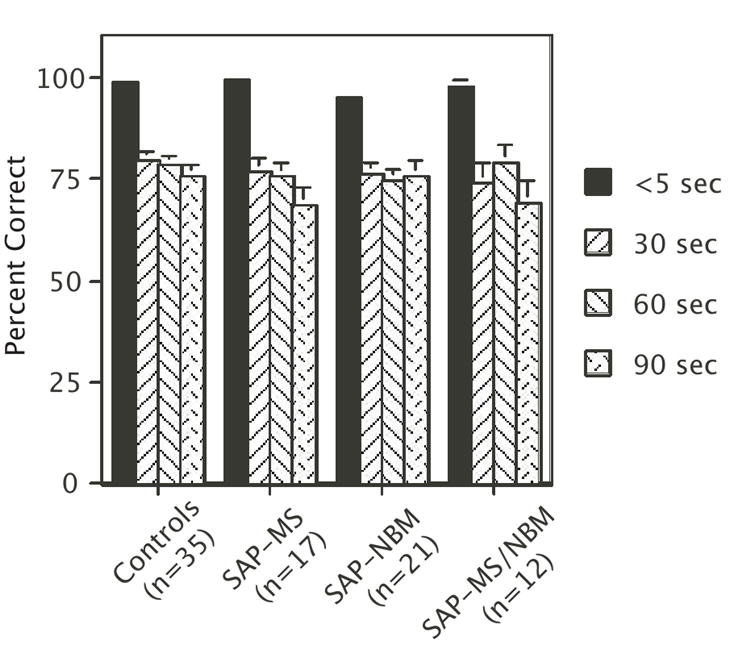
Figure 4.

Bar graph summarizing the effects of increasing the intertrial delay on performance of the DMP task Bars represent mean percent correct ± s.e.m. Note that there was a main effect of Delay on performance, but no affect of Treatment and no interaction between Treatment and Delay (see text for statistics).
