
Figure 5.
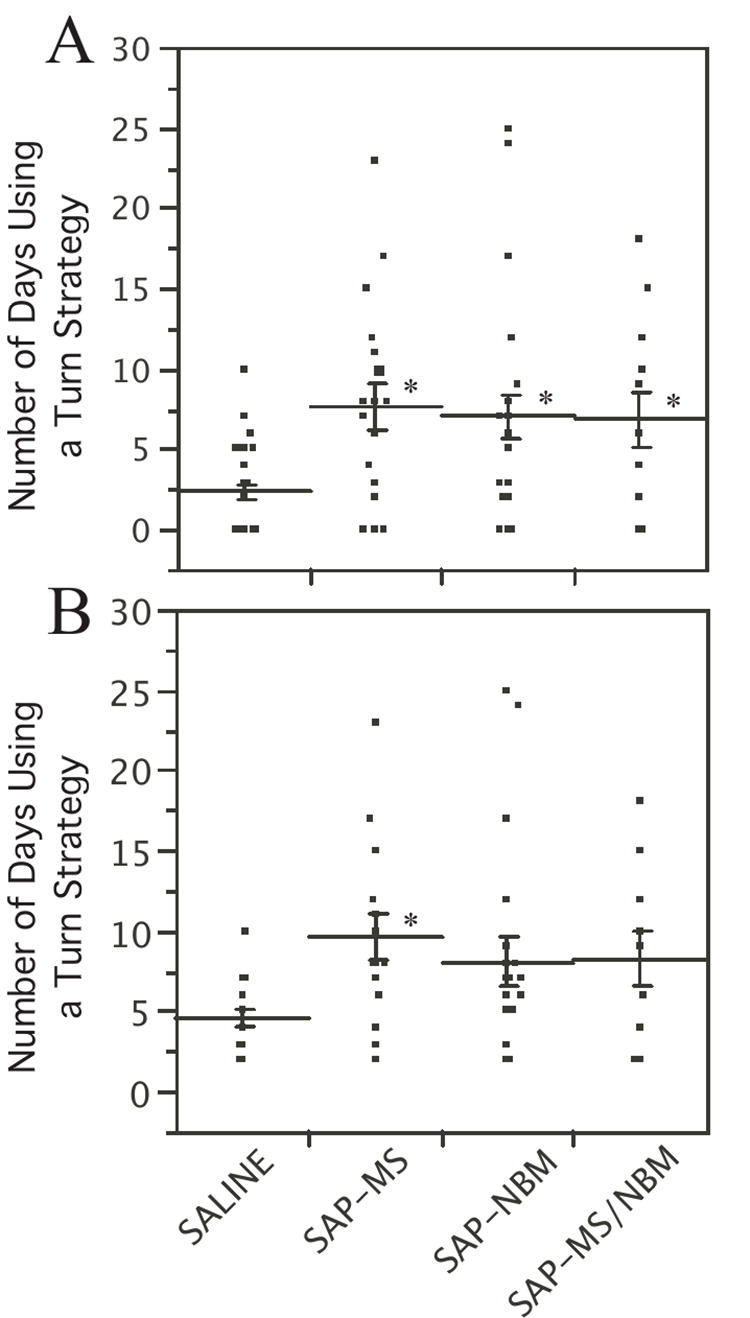
Scatter plot showing the number of days that rats engaged in a turning strategy during DMP training Lines indicate mean ± s.e.m. Panel A shows data for all rats. Panel B shows data only for rats that met the definition of having adopted a turning strategy. *p<0.05 relative to saline-treated controls.