
Figure 7.
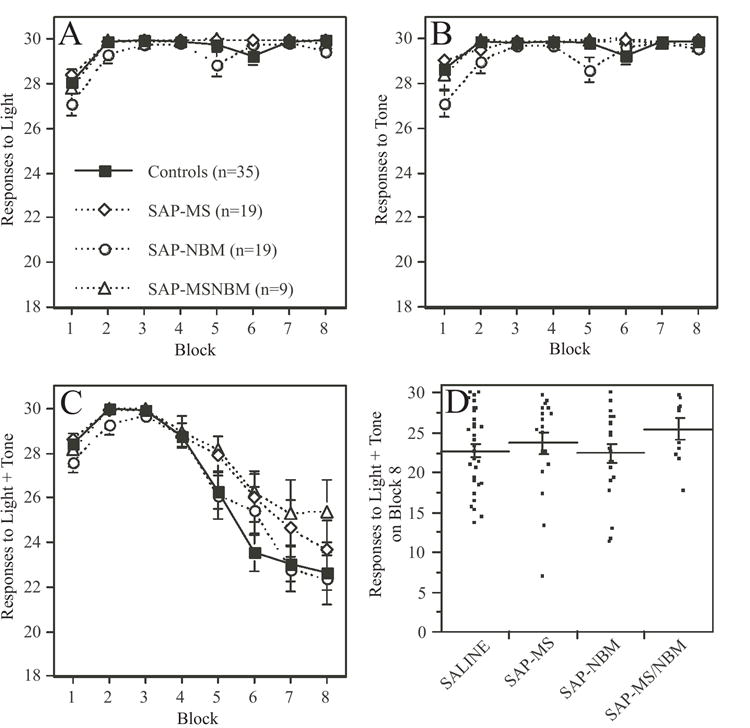
Plots summarizing the effects of the SAP lesions on the number of responses to the simple and configural stimuli during acquisition of the CA task The data are grouped into eight 3-day blocks of training. In panels A-C, each data point represents a group mean ± s.e.m. Panels A and B show the mean number of responses (maximum of 30) to presentation of either the light or the tone. Note that animals quickly learn to associate light or tone with food reward. ANOVA revealed that animals in the SAP-NBM group performed slightly worse than animals in the other groups (see text for statistics). Panel C shows the mean number of responses (maximum of 30) to presentation of the combined stimulus of light + tone. Note that animals initially increased their responses to the configural stimulus, but over time reduce their responses as they learned to distinguish between the lack of reward associated with responding to the configural stimulus versus the positive reward associated with responding to the simple stimuli. There was no significant effect of Treatment on responses to the configural stimulus. Panel D is a scatter plot showing each rat’s mean number of responses to the combined stimulus on Block 8 of training. Lines indicate mean ± s.e.m. Note the considerable variance in responses after 24 days of training.