
Fig. 1.
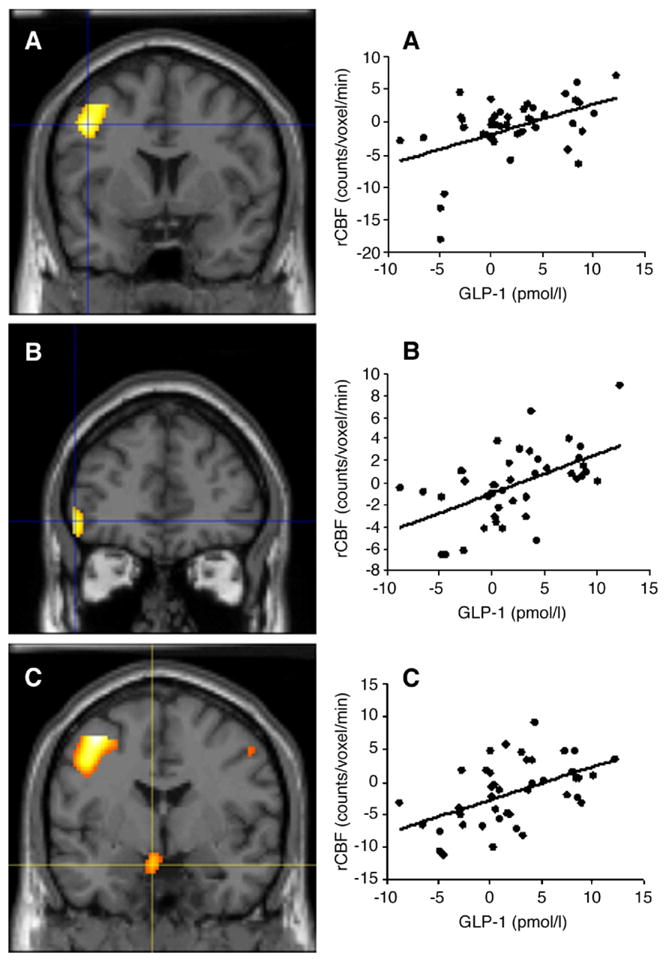
Left panels: Coronal views of the left middle frontal gyrus (A; x=−34, y=−3, z=47), left inferior frontal gyrus (B; x=−45, y=39, z=−4), and hypothalamus (C; x=−4, y=−5, z=−16), where the postprandial change in regional cerebral blood flow (rCBF) is positively correlated with the postprandial change in plasma glucagon-like peptide-1 (GLP-1), after adjustment for sex, age, body fat, and changes in plasma glucose, insulin, and serum free fatty acid (FFA) concentrations in the study subjects. Right panels: Scatter-plots of rCBF in the left middle frontal gyrus (A), left inferior frontal gyrus (B), and hypothalamus (C), as function of the postprandial GLP-1 response.