
Figure 2.
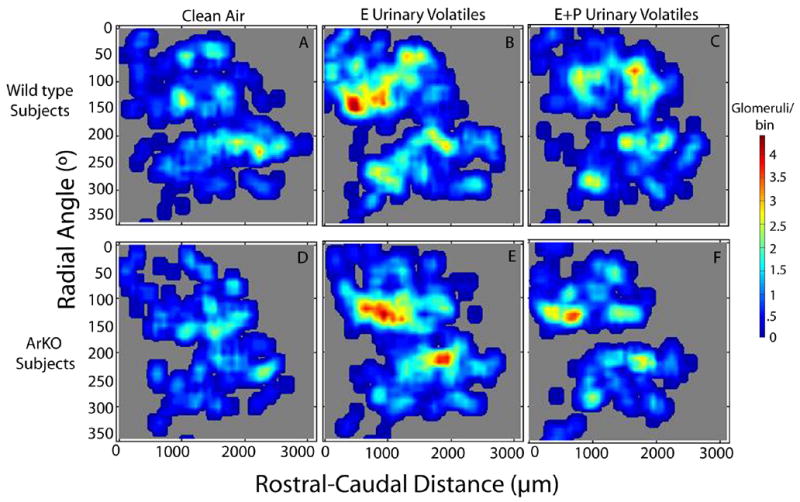
Contour plots showing areas of greatest glomerular activation in WT females exposed to clean air (A; n=5), E female urinary volatiles (B; n=5), or E+P female urinary volatiles (C; n=5), as well as ArKO females exposed to clean air (D; n=4), E female urinary volatiles (E; n=5), or E+P female urinary volatiles (F; n=5). The scale showing the number of activated glomeruli per bin (72μm thickness, 10° radial angle) is located to the right of the panels.