
Figure 3.
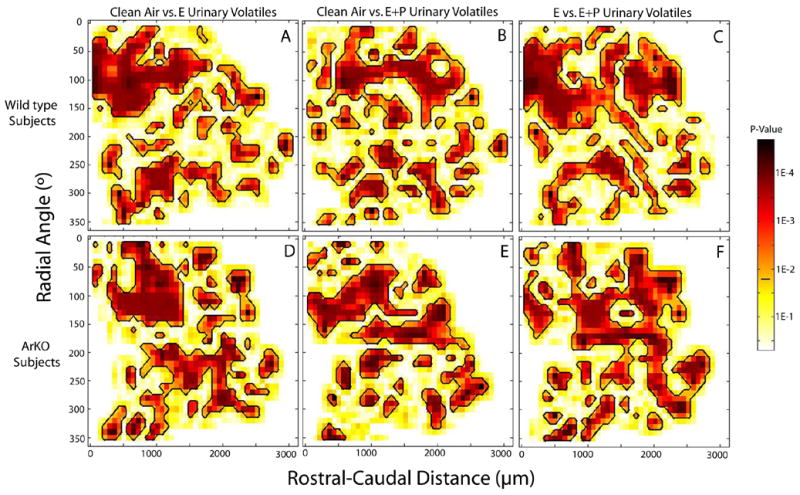
Regions showing significant differences in glomerular activation in the main olfactory bulb between the contour plots shown in Figure 2. Panels A–C depict statistical comparisons between WT groups, while panels D–F show comparisons between ArKO groups. Point by point Mann Whitney U tests showed widespread significant differences (outlined in black) in all comparisons including clean air versus E urinary volatiles (A,D), clean air versus E+P urinary volatiles (B,E), and E vs E+P urinary volatiles (C,F). p<False Discovery Rate (FDR) cutoff value (.025) indicated by the horizontal black bar on the color scale located to the right of the plots.