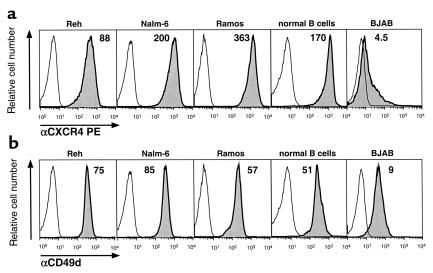
Figure 6.
Expression of CXCR4 or CD49d (VLA-4) by different B-cell lines or normal blood B cells, as indicated. Displayed are fluorescence histograms depicting the relative red fluorescence intensity of the cells stained with anti-CXCR4 mAb’s (a, shaded histograms) or with anti-CD49d mAb’s (b, shaded histograms) compared with that of the same cells stained with a PE-conjugated isotype control mAb of irrelevant specificity (open histograms). The mean fluorescence intensity ratio of each specifically-stained cell population is displayed above the histograms.

