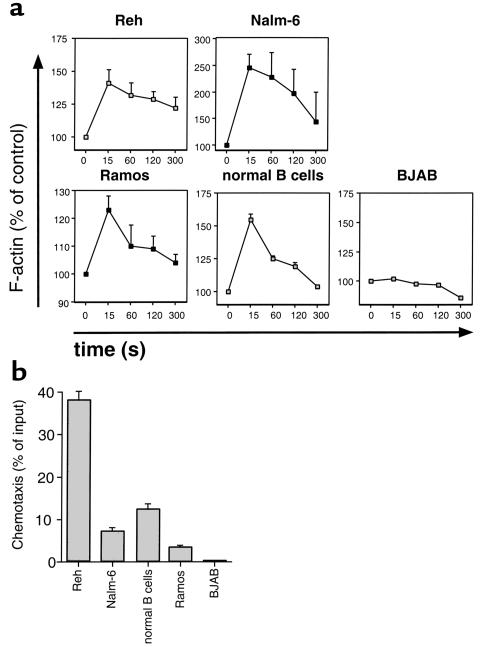
Figure 7.
Responses of B-cell lines or normal blood B cells to SDF-1α. (a) Intracellular F-actin was measured using FITC-labeled phalloidin after the addition of 100 ng/ml SDF-1α at time 0. Results are displayed as percent of intracellular F-actin relative to that prior to the addition of SDF-1α, for each cell line, as indicated above the box for each graph. The lines connect the data points that are the mean ± the range of two independent experiments. (b) SDF-1α induces chemotaxis of B-cell lines or normal blood B cells, but not BJAB B cells. Blood B lymphocytes or B-cell lines, as indicated, were assayed in the bare filter chemotaxis assay for migration toward 100 ng/ml of SDF-1α. The bars represent the mean (± range) relative proportion of input B cells that had migrated in response to SDF-1. Migration to control wells containing medium alone was less than 1% in all cases.

