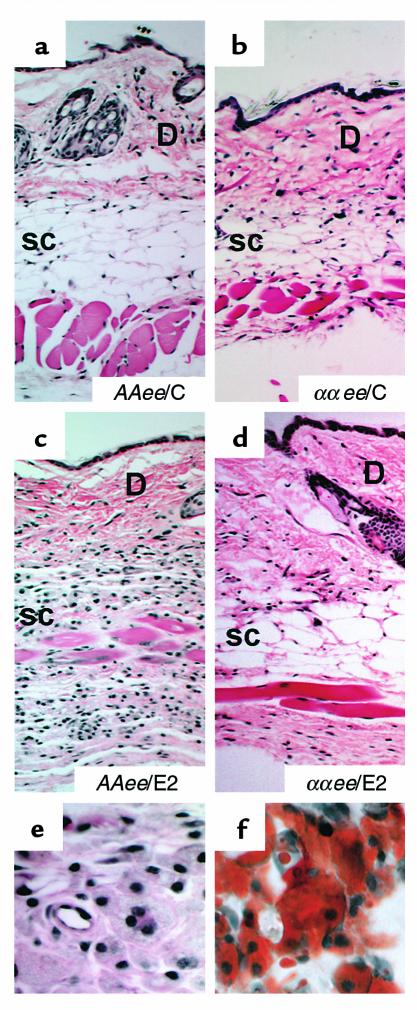
Figure 5.
Histological sections of dorsal skin at sacrifice. H&E stain; 10×. (a) AAee/C; (b) ααee/C; (c) AAee/E2; (d) ααee/E2; (e) 40× magnification of AAee/E2 skin; (f) Sudan IV stain of AAee/E2 skin, 40× magnification. Note the infiltration of lipid-laden macrophages or foam cells (xanthoma formation) in the subcutaneous fat (SC) of AAee/E2 skin. The dermis (D) is positioned at the top.

