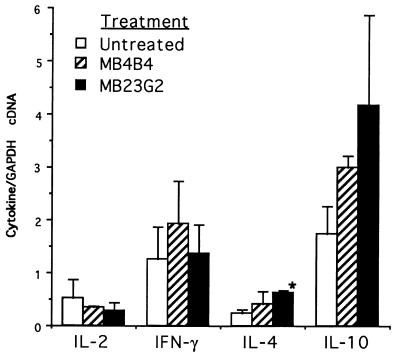
Figure 5.
Cytokine transcript expression by quantitative RT–PCR in allografts from untreated control animals, anti-CD45RB (MB23G2)-treated animals, and anti-CD45RB (MB4B4)-treated animals. Peri-islet tissue obtained 6 days after transplantation was analyzed by RT–PCR for each cytokine mRNA using competitive templates and normalized to the amount of GAPDH in each sample. Two animals were analyzed for each treatment group. Data are the ratio of pg of cytokine cDNA per pg of GAPDH mRNA. ∗, P ≤ 0.025 compared with control (for comparisons between other groups, P > 0.05).

