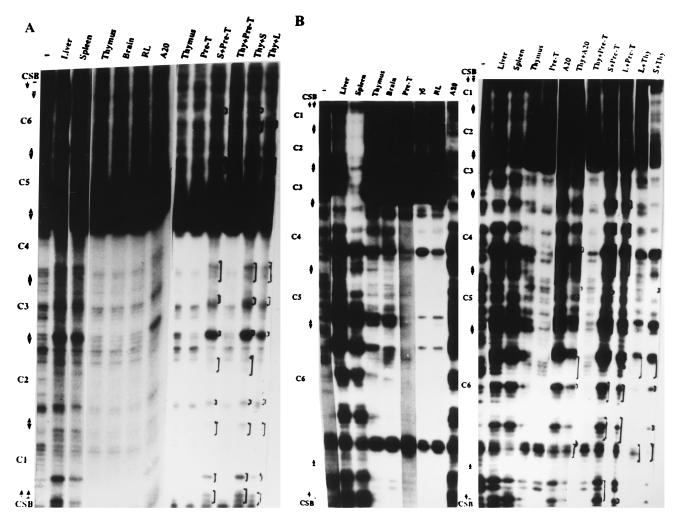
Figure 4.
Comparison of footprinting patterns established on CSB by nuclear extracts of various mouse tissues and cultured cell lines. A CSB-containing fragment was analyzed by DNase I footprinting, as described in the text. The autoradiograms of DNase I digestion of the top strand and the bottom strand are shown in (A) and (B), respectively. Nuclear extracts from various tissues and cell lines, and mixed nuclear extracts of spleen and pre-T (S+Pre-T), thymus and pre-T (Thy+Pre-T), thymus and spleen (Thy+S), thymus and liver (Thy+L), thymus and A20 (Thy+A20), or liver and pre-T (L+Pre-T) were used in the assays. −, No nuclear extract. The regions corresponding to subregions of CSB, shown in Fig. 3A, are indicated on the side of each gel. The bracketed regions indicate the regions with footprint pattern changes in mixed nuclear extracts when compared with the pattern produced by thymus, pre-T, or Thy+Pre-T.

