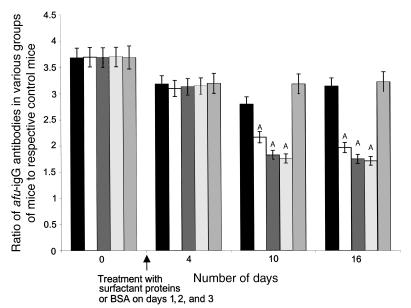
Figure 3.
Ratio of Afu-IgE Ab’s (estimated by indirect ELISA as described in Methods) of the untreated ABPA mice (black bars), SP-A–treated ABPA mice (white bars), SP-D–treated ABPA mice (dark gray bars), rSP-D–treated ABPA mice (light gray bars), and BSA-treated ABPA mice (medium gray bars) to their respective controls observed on day 0, 4, 10, and 16 of the treatment study. Each value represents a mean of nine readings (triplicate values from three animals of each group). Absorbance values ± SD for the control groups observed on day 16 are as follows: untreated control, 0.095 ± 0.011; SP-A–treated control, 0.072 ± 0.014; SP-D–treated control, 0.068 ± 0.012; rSP-D–treated control, 0.071 ± 0.010; and BSA-treated control (0.105 ± 0.018). AP < 0.05 compared with the values of the untreated ABPA mice on the same day.

