
Figure 2.
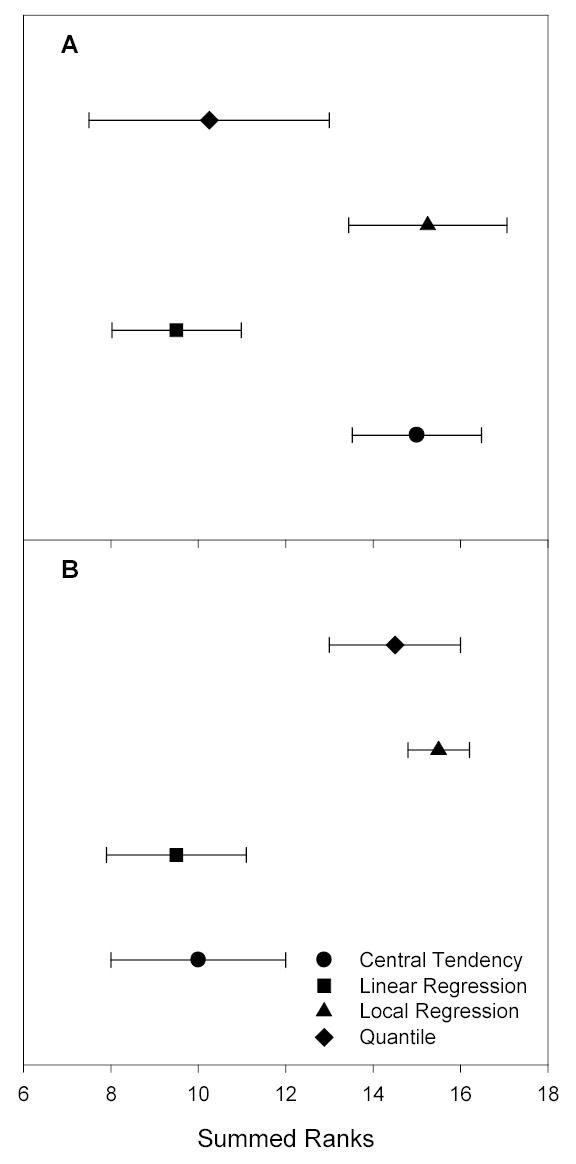
Comparison of summed ranks for central tendency, linear regression, local regression, and quantile normalization approaches applied to LC-FTICR MS runs without biological variability. (a) Ranks by percent reduction in extraneous variability estimated as PEV. Note that the lower the value of the summed rank, the greater the percent reduction in this estimate of extraneous variability. Linear regression and quantile normalization performed similarly and received better rankings than central tendency and local regression normalization. (b) Ranks by percent reduction in extraneous variability estimated by the median CV. Here, central tendency and linear regression normalization performed similarly, and better than local regression and quantile normalization.