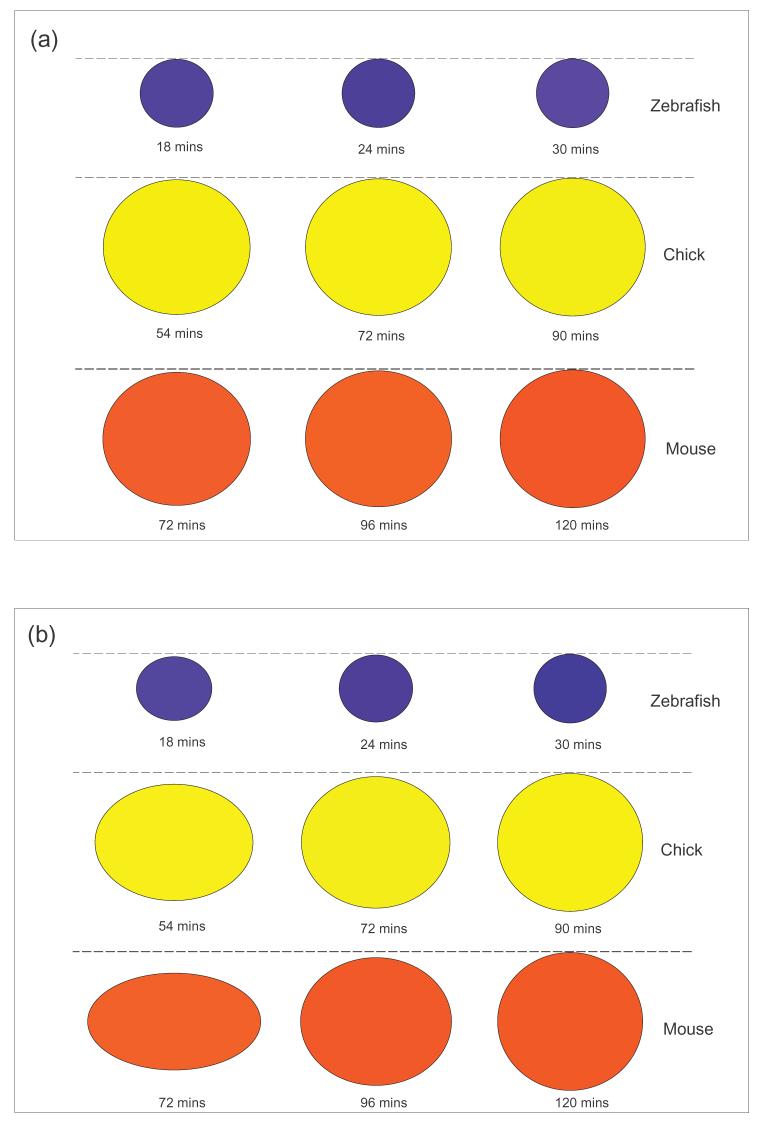
Figure 2.
Morphological changes of a tissue due to cell movement driven by tissue surface tension for: (a) σ/μ = 1.5 × 10⁻⁶ cm/s (typical average value found in tissues) (b) σ/μ = 5 × 10⁻⁶ cm/s (a value particularly larger than found in most experiments). Given the final shape of the somite, we use the viscous liquid model, encapsulated by Eq. (1), to regress back in time and calculate the shape of the somite at times equal to 60% and 80% of the somite formation time. The somite formation time is 30 mins, 90 mins and 120 mins for zebrafish (blue), chick (yellow) and mouse (red) somitogenesis, respectively. Note that according to the model changes in shape are almost negligible for the zebrafish and they are significant for the chick and the mouse only when the ratio σ/μ is larger than the typical average found in experiments.

