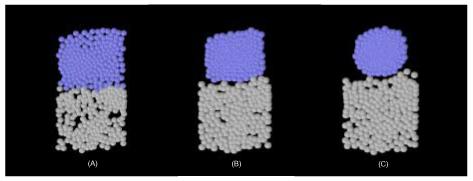
Figure 3.

Computer simulation of the proposed chemotactic mechanism in two dimensions. Grey colored cells form part of the PSM while blue colored cells form part of the region s0. The top represents the anterior part of the PSM and the bottom represents the posterior part of the PSM. The PSM is shown at three different times (A) just after chemoattractant pulses have been simultaneously secreted by all cells in s0 (B) an intermediate time, in which cells close-pack together (C) late time configuration, in which the s0 region has rounded up due to the cells experiencing a chemotactic centripetal force. At this time, the cells have stopped producing chemoattractant but the shape is preserved due to heightened cell-cell adhesion in s0.
