Fig. 5.

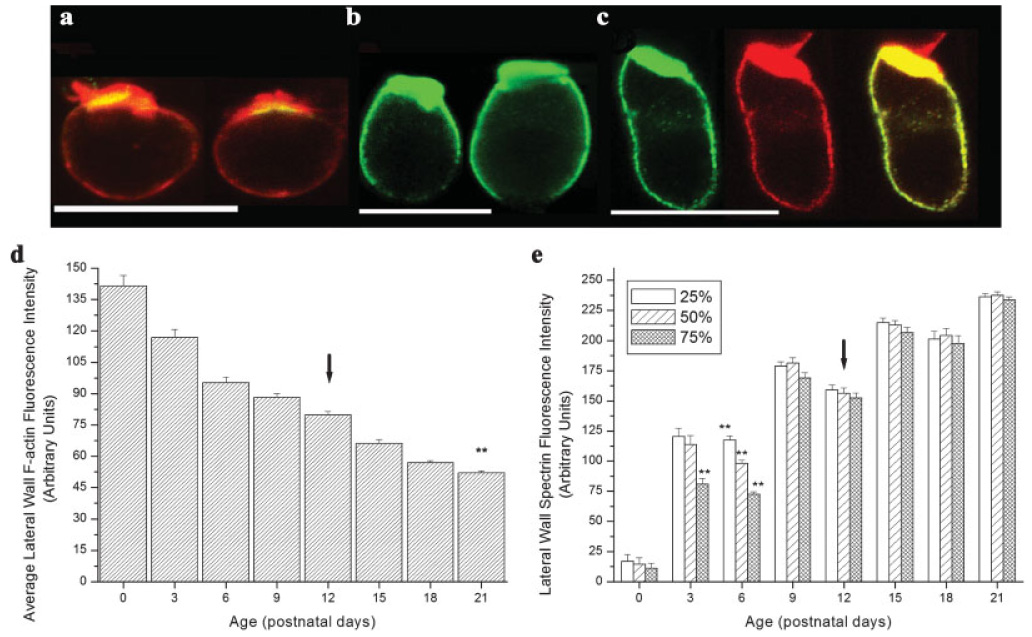
Alterations in lateral wall F-actin and spectrin accumulation during postnatal development. (a) F-actin is reduced in the OHC lateral wall during development (F(7,764) = 162.3, P < 0.01). Immature OHCs (P0–P18) have more lateral wall F-actin than mature OHCs (P21). (b) Increases in lateral wall spectrin accumulation occur between P0 and P21. Significant regional differences in lateral wall spectrin labeling were observed at P3 and P6 (F(2,117) = 10.75, P < 0.01, F(2,204) = 56.37, P < 0.01, respectively). (c–e) F-actin (red) and spectrin (green) labeling in isolated P0, P6 (spectrin only) and, P9 OHCs. Regions of F-actin and spectrin colocalization are depicted as yellow. By P9 F-actin and spectrin were present throughout the OHC lateral wall. Arrow = hearing onset, ** = P < 0.001. Scale bars = 10 µm.
