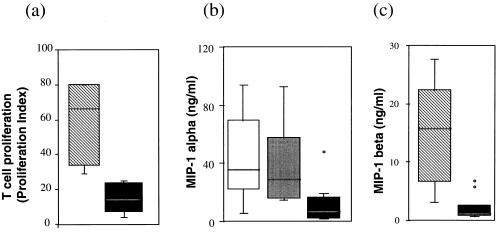
Figure 2.
Box plot analysis of T cell proliferation (a) MIP-1α (b) and MIP-1β (c) production in PBMC from seropositive individuals. PHA-activated fresh PBMC were cultured for 48 h, and T cell proliferation was evaluated by a 3H-thymidine incorporation test. MIP-1α and MIP-1β were measured in the culture SN by ELISA. Shown are groups of seropositive individuals with: CD4+ T cell counts >500 per mm3 (▧); with CD4+ T cells <250 per mm3 (▪); seropositive at an early stage (░⃞); and nonprogressors (□). Horizontal bars = median and vertical bars = SD. The box limits correspond to the medium 50% percentage of each group.

