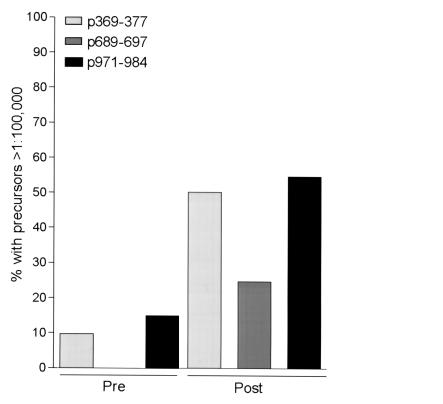
Figure 4.
The majority of patients could be immunized to HLA-A2 HER-2/neu peptides. Data are shown as the percentage of the population before immunization and after immunization that had a detectable ELIspot response to each of the HER-2/neu, HLA-A2 peptides, p369–377 (light gray bar), p689–697 (dark gray bar), p971–979 (filled bar). The mean (range) preimmunization HER-2/neu–specific precursor frequency of patients considered as having a positive response to p369–377 was 125 (32–217, two patients only), to p689–697 (no patients), and to p971–979 was 74 (13–135, two patients only). The mean (range) maximal postimmunization HER-2/neu–specific precursor frequency of patients considered as having a positive response to p369–377 was 111 (11–417), to p689–697 was 60 (25–143), and to p971–979 was 97 (13–185).

