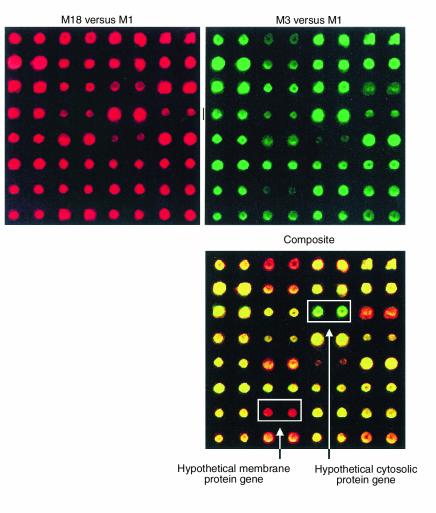
Figure 3.
Comparative genome analysis of three GAS strains with a DNA microarray. The array was constructed with PCR products formulated on the basis of a genome sequence available for a serotype M1 strain (38). Approximately 99% of the M1 open reading frames were represented in duplicate on the array. Shown for illustrative purposes are the hybridization results obtained from only one sector of the entire genome array. Sheared genomic DNA from an M18 strain and an M3 strain were labeled with fluorescent dyes Cy5 and Cy3, respectively, and hybridized to the M1 microarray. The hybridization results were analyzed with a ScanArray 5000 laser scanner and QuantArray software package (Packard Biosciences, Meriden, Connecticut, USA). The composite image (bottom) shows that a genomic segment encoding a hypothetical cytosolic protein (green) is unique to this M3 strain, whereas a genomic segment encoding a hypothetical membrane protein (red) is unique to this M18 strain. The yellow spots represent DNA that is present in these M1, M3, and M18 strains.

