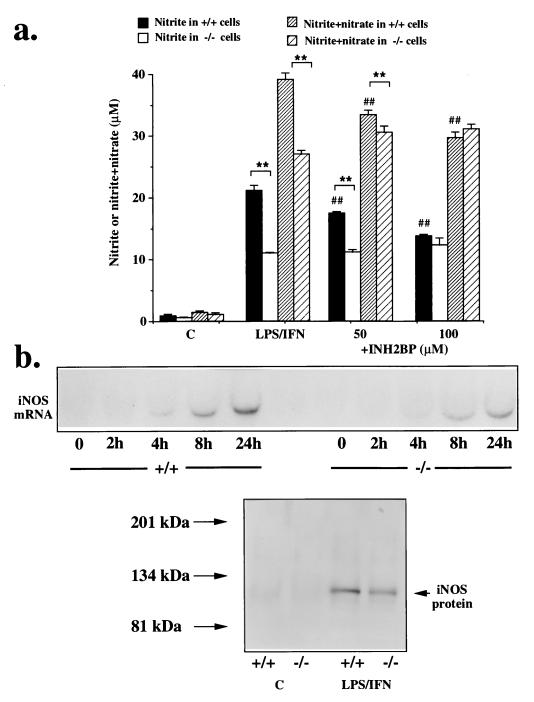
Figure 3.
(a) Concentrations of nitrite (solid bars) or nitrite and nitrate (hatched bars), in PARS+/+ and PARS−/− fibroblasts immunostimulated with LPS/IFN-γ for 24 h; effect of INH2BP (50–100 μM). ∗∗ represents significant effects of immunostimulation compared with unstimulated controls (P < 0.01); ## represents significant effect of INH2BP in the PARS+/+ cells (P < 0.01); n = 6–9. (b) Comparison of the level of iNOS mRNA (at 2, 8, 12 and 24 h) and iNOS protein (at 12 h) expression in PARS+/+ and PARS−/− cells in response to stimulation with IFN-γ and LPS. Representative blots of n = 3 or 4 experiments are shown.

