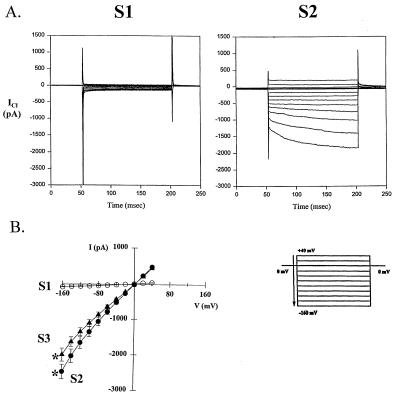
Figure 2.
Cells overexpressing ClC-2 have HACCs at physiologic pH. (A) Representative whole-cell Cl− current recordings of an S1 cell expressing endogenous levels of ClC-2 and an S2 cell overexpressing ClC-2 at pH 7.45. The holding potential was 0 mV, and voltage was stepped to +40 mV for 20 msec then decreased in 20-mV increments to −160 mV. (B) Current–voltage plot of mean responses for S1 cells (n = 6) and for cells S2 (n = 17) and S3 (n = 10). Error bars indicate the standard error of the mean. Asterisks indicate a significant difference (P < 0.05) in current amplitude at −160 mV between S1 and S2 cells and between S1 and S3 cells using anova and Bonferroni ad hoc tests.

