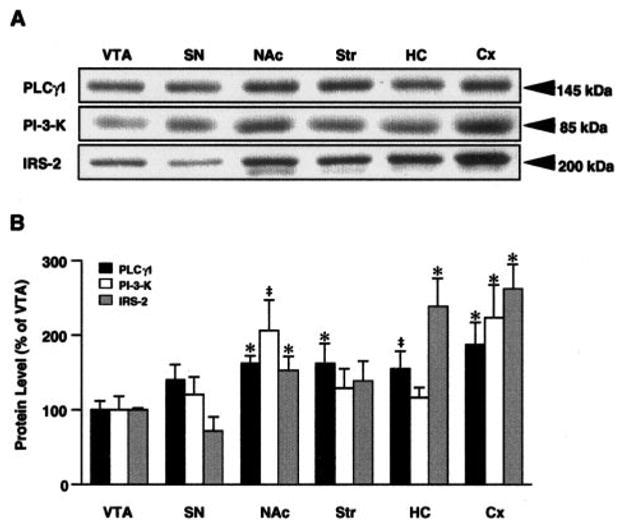
FIG. 1.

Relative expression of PLCγ1, PI-3-K, and IRS-2 in six brain regions: VTA, SN, NAc, striatum (Str), HC, and Cx. Brain regions were obtained by dissection from naive rats and extracts subjected to western blot analysis with the antibodies indicated. A: Representative lanes of autoradiograms derived from samples of individual rats. Each band shown was the dominant bandon the membrane, and the Mr is appropriate for each protein. B: Percent relative levels compared with VTA. Data are average ± SEM (bars) values from four rats in this analysis. *p ,< 0.05, ‡p = 0.05–0.07 (indicates a trend toward significance).
